In the previous article, I covered how to instrument your project with Stackdriver Trace, a tool that lets you understand the latency of your requests.
So we now have traces accumulating for us to find out the main bottlenecks of our app.
Now, try filtering...
One problem though, is that Stackdriver's "search" is quite frustrating: you can filter traces using some predicates that will only let you use either prefix or exact values on the endpoint's URL that was traced or the labels that were applied to the trace.
It works for endpoints with a fixed URL, like POST /payments, but not so much with parameterized endpoints such as POST /payments/<payment_id>/refund: the /payments prefix will give you too many different endpoints, whereas the <payment_id> param in the URL prevents you from filtering on all refund calls to get an overview of that endpoint's performance.
A workaround
Labels
To work around that limitation, what we can do is mark all those requests with a single label that will identify each endpoint uniquely.
By doing so, we'll get a way to use Stackdriver Trace's filtering system efficiently by looking for an exact match on the label that identifies a given endpoint, no matter whether that endpoint uses parameters or not.
With Flask, we can use request.url_rule.rule to get the URL template of the endpoint that's handling the current route. With Django, we'd use something like request.resolver_match.route.
If you're using another lib/framework, I'm sure you will find an equivalent!
So we know where we want to go, we just need to figure out how to apply those endpoint labels to the generated traces.
Using a custom exporter
When OpenCensus collects some spans, it sends them to Stackdriver Trace using a StackdriverExporter instance, which we configured in the previous article:
def trace_app(app):
    exporter = StackdriverExporter(project_id=GCP_PROJECT_ID, transport=AsyncTransport)
    tracer = tracer_module.Tracer(exporter=exporter)

    FlaskMiddleware(app, exporter=exporter)

    config_integration.trace_integrations(
        integrations=["sqlalchemy", "requests", "google_cloud_clientlibs"], tracer=tracer
    )
Each span generated by OpenCensus will have a list of attributes such as http.host or http.method, and the Stackdriver exporter will map those attributes to labels it understands, such as /http/hosts and /http/method.
That's what's displayed in a span's details panel on the Cloud Console:
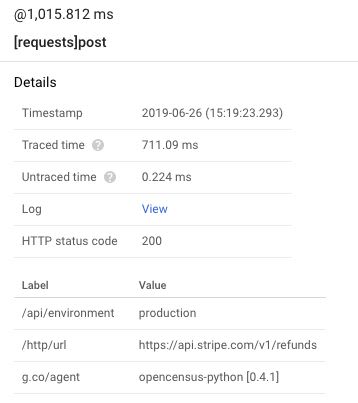
In that screenshot, the /api/environment label is actually a custom label I have added to our own traces to differentiate between production and staging traces (because both environments live in the same GCP project at the moment).
Creating the custom exporter
To add our new labels, we will:
- Create a new
Exporterclass inheriting fromStackdriverExporter - Override its
emitmethod to add labels (i.e.attributes) to all the exported spans - Use that new class in our
trace_appfunction above to start tracing with custom labels
Regarding #2, I'm choosing to override emit because if you start exploring StackdriverExporter's source code, you'll see that the span_datas it is passed will be transformed to Stackdriver-compliant JSON, and that includes transforming the key/value attributes dict of a span into a more complicated structure.
With what we want to do, I figured the easiest thing to do is to add our attributes to each span before they're transformed, and then let the original exporter do its thing.
As a result, our custom exporter is actually pretty simple:
class CustomExporter(StackdriverExporter):
    def emit(self, span_datas):
        for span in span_datas:
            span.attributes["/api/endpoint"] = request.url_rule.rule

        super(CustomExporter, self).emit(span_datas)
Now if we want to use it, we just have to update our trace_app function:
def trace_app(app):
    exporter = CustomExporter(project_id=GCP_PROJECT_ID, transport=AsyncTransport)
    tracer = tracer_module.Tracer(exporter=exporter)

    FlaskMiddleware(app, exporter=exporter)

    config_integration.trace_integrations(
        integrations=["sqlalchemy", "requests", "google_cloud_clientlibs"], tracer=tracer
    )
That's it!
What it looks like
I have used this code in a dummy Flask project to generate a few traces of random duration:
@app.route('/hello/<name>', methods=["GET"])
def hello_world(name):
    delay = random.randint(20, 1000)
    resp = requests.get(f"http://www.mocky.io/v2/5d4ee893300000975829609f?mocky-delay={delay}ms")
    return resp.text
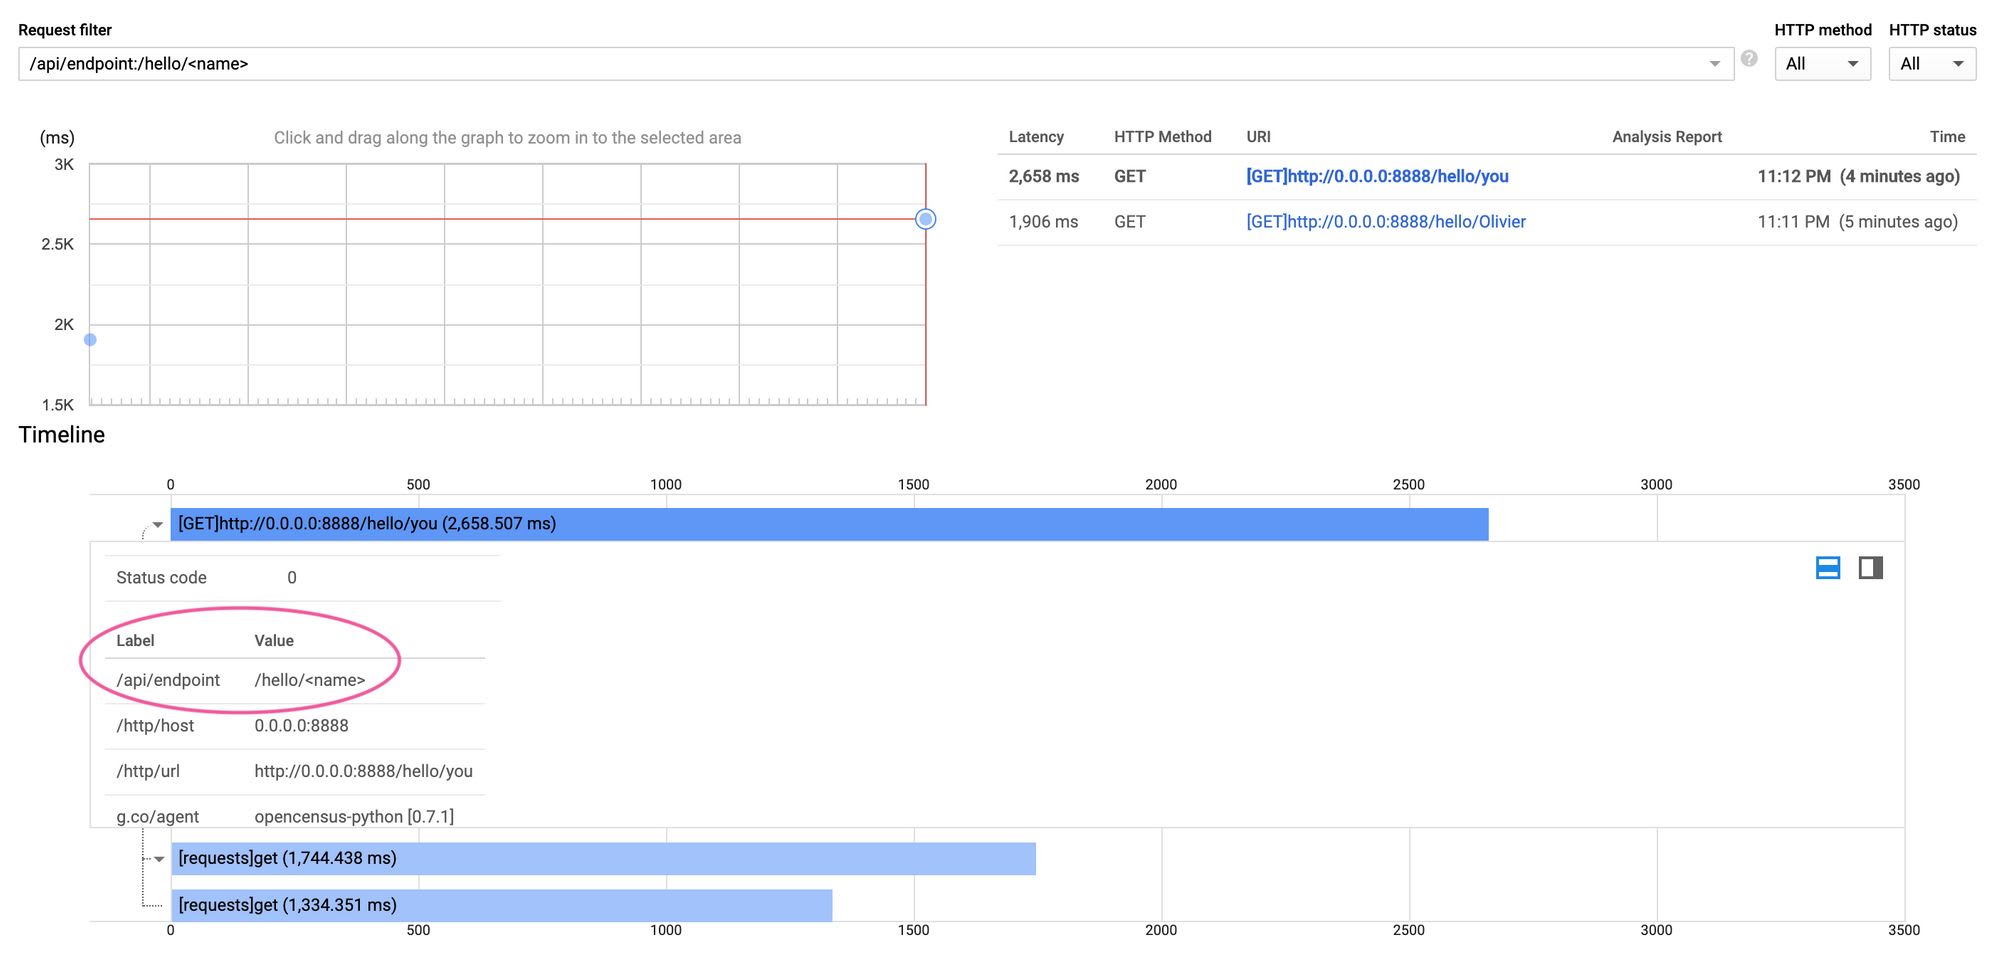
After I hit /hello/something on my local server a couple times, I could successfully find the generated traces on Cloud Console using the /api/endpoint:/hello/<name> label filter. The beauty of this is that I just have to copy and paste the argument to the @app.route call to find the latency data for all the different calls to any endpoint!
Wrapping up with a PR
Stackdriver Trace's search/filtering is too basic to be useful with real APIs that use parameterized endpoints such as /resources/<resource_id>/action.
However, with just a little bit of code, it's quite easy to come up with a solution that works pretty well around that limitation.
It seemed so simple that I thought the Flask middleware provided by OpenCensus should do that by default, so I looked into the extension code and found that it was actually not following the OpenCensus specifications:
tracer.add_attribute_to_current_span(
    HTTP_PATH, flask.request.path
)
tracer.add_attribute_to_current_span(
    HTTP_ROUTE, flask.request.path
)
The extension sets both http.path and http.route to flask.request.path, while the specs make a clear difference between the two:
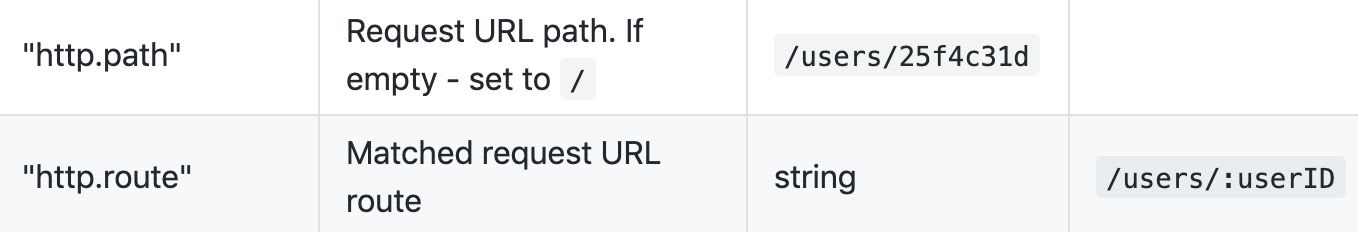
And the same error has been made for the Django and Pyramid extensions.
I fixed the behaviour on the Flask one (for now) and submitted a PR.
It's been merged to the main codebase, so we should all reap the benefits from this article's research soon! ☺️
Until it's released, I hope you learned a thing or two here!
