The backstory
When you're working on a Web service that other people/businesses depend on, such as an API, responding in a timely manner is often seen as a quality criterion.
Some companies like Algolia have even made it a motto with their #millisecondsmatter hashtag!

Sometimes you're even required to reply in under a given amount of time, to comply with a third-party timeout requirement for instance.
That's exactly what bit me the other day while working on a API endpoint that's used as a handler for a Shopify webhook.
Never trust webhooks
I'm working on a Shopify app that registers itself to the shops' refunds webhook to perform some processing when certain types of refunds happen on the shops.
Things had been going great, until one day I realized that Shopify was sometimes sending me multiple HTTP calls for the same webhook event, even though my handler had correctly replied with a 200 OK response.
You see, webhooks are Murphy's Law's hidden children: if anything can go wrong with a webhook, it will! I was naive enough to ignore this fact and had not taken all the required precautions.
First, I missed very important information in Shopify's documentation (emphasis mine):
Shopify waits five seconds for a response to each request to a webhook. If there is no response, or an error is returned, then Shopify retries the connection 19 times over the next 48 hours.
Looking at my logs, I discovered that some of the webhook calls were indeed taking more than 5 seconds to be processed. The 200 OK response did not matter in this case. Shopify was definitely going to retry those calls.
To make things worse, I had not taken care of the idempotency of my operations on this webhook handler and so I ended up processing refunds multiple times instead of dropping duplicate calls for the same refund.
What's taking so long?!
You probably scoffed when reading that previous paragraph. Five seconds! Really? What could possibly take that long?
That's what I set out to discover.
To do so I relied on traces collected in Stackdriver Trace, something I had proactively set up on my project, which proved very useful here.
So let's dive into what are traces, how they can help and how you can set them up in your own project.
Traces & spans
A trace is a measurement of your code's execution time. It is represented as a tree of spans, which represent single operations as a time range (the operation's latency/execution time) along with some metadata.
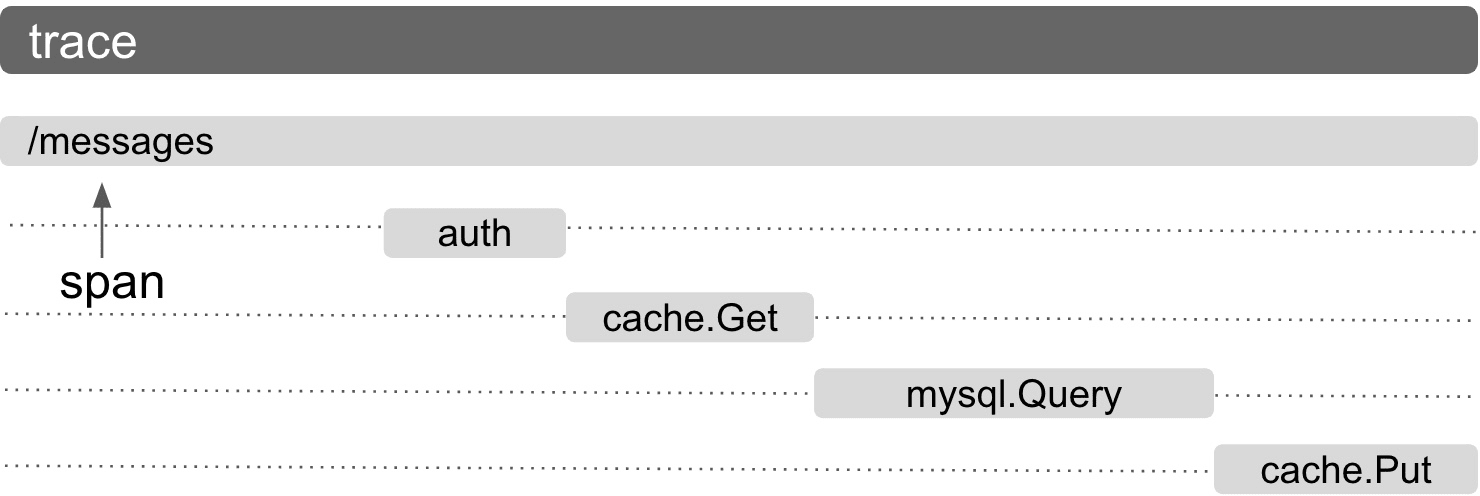
The tree representation allows the identification of parent/children relationship between spans. In other words, you know which operation started another one.
The tracing tools we'll cover here are specifically meant to trace HTTP requests, so one trace will be the full HTTP request, from reception to response, and its underlying spans will show how long it took to perform each operation within that request handling.
Tracing set up
Why Stackdriver Trace?
I am working on a Python application, hosted on Google Cloud Platform.
That made my choice of using Stackdriver Trace a default one.
There are plenty of other tools around that perform tracing and other application performance monitoring, such as New Relic, Datadog, Dynatrace... they all come with different features, pricing and probably different qualities. I haven't tested them, so I can't tell 🙂
The tracing stack
So we're using Stackdriver Trace as a tracing analyzer/browser/... but we need to feed the tool with those traces.
The recommended way for collecting traces with Stackdriver is to use OpenCensus:
OpenCensus is a set of libraries for various languages that allow you to collect application metrics and distributed traces, then transfer the data to a backend of your choice in real time. This data can be analyzed by developers and admins to understand the health of the application and debug problems.
If you don't use GCP or Python, you can continue reading: OpenCensus has support for other languages and integrations with other distributed tracing platforms (such as Zipkin, Azure, ...).
As far as traces are concerned, OpenCensus acts as a central aggregator of traces generated by other modules, which register themselves against OpenCensus.
When traces are generated by those modules and collected by OpenCensus, it will export them to the configured exporter(s).
OpenCensus was originally developed by Google and it comes with a ready-to-use StackdriverExporter class, which makes it quite straightforward to set up.
In the app I'm working on, we're using:
- Flask
- Requests (directly, or as an underlying HTTP library used by other critical packages of our stack such as Stripe)
- SQLAlchemy
- Some Google Cloud Platform libs
OpenCensus provides tracing packages for each of these items, so we'll need to install them and then set everything up.
The set up
To support our stack, we need to add a few modules to our requirements.txt file:
# Google's lib to communicate with Stackdriver Trace
google-cloud-trace==0.20.2

# OpenCensus itself
opencensus==0.4.1

# Modules to support tracing for our stack
opencensus-ext-sqlalchemy==0.1.1
opencensus-ext-requests==0.1.1
opencensus-ext-google-cloud-clientlibs==0.1.1
opencensus-ext-flask==0.2.0
opencensus-ext-stackdriver==0.2.1
We can now import and initialize the whole thing:
from config import GCP_PROJECT_ID
from opencensus.common.transports.async_ import AsyncTransport
from opencensus.ext.flask.flask_middleware import FlaskMiddleware
from opencensus.ext.stackdriver.trace_exporter import StackdriverExporter
from opencensus.trace import tracer as tracer_module
from opencensus.trace import config_integration

def trace_app(app):
    exporter = StackdriverExporter(project_id=GCP_PROJECT_ID, transport=AsyncTransport)
    tracer = tracer_module.Tracer(exporter=exporter)

    FlaskMiddleware(app, exporter=exporter)

    config_integration.trace_integrations(
        integrations=["sqlalchemy", "requests", "google_cloud_clientlibs"], tracer=tracer
)Because we want to trace a Flask application, I put the initialization code into a function that will receive the Flask app to trace as an argument.
The first step is to create the exporter that will send the traces to Stackdriver. In my case I don't need to give it more than our GCP project ID because our app is running on Google Kubernetes Engine, and the Google libs know how to connect to GCP services in that context. Your mileage may vary!
The tracer instance is the tracing orchestrator, it communicates with the exporter when traces are collected.
Finally, we tell OpenCensus which tracing integrations it should use. Their respective packages will be loaded automatically.
That's all there is to it.
Now, whenever a Flask app is initialized, I can call trace_app to trace it:
from flask import Flask
from tracing import trace_app

app = Flask(__name__)
setup_tracing(app)
Using the traces
Going to Stackdriver Trace, you are presented with a traces explorer with a search bar and a graph. Here, I searched for all traces with a latency of 3 seconds or more:
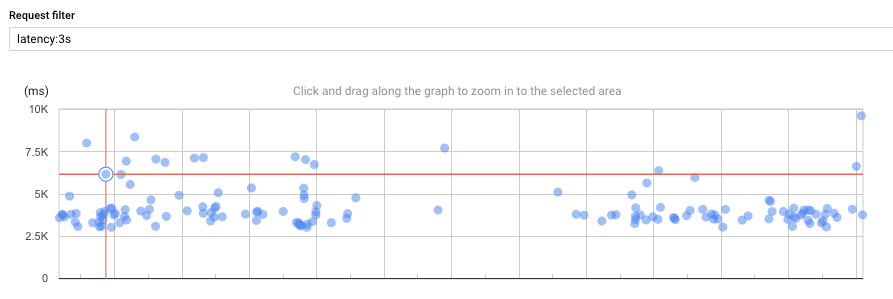
There are many here that are actually expected, like scheduled tasks and some long-lasting operations.
Here's what you get when you click on a trace:
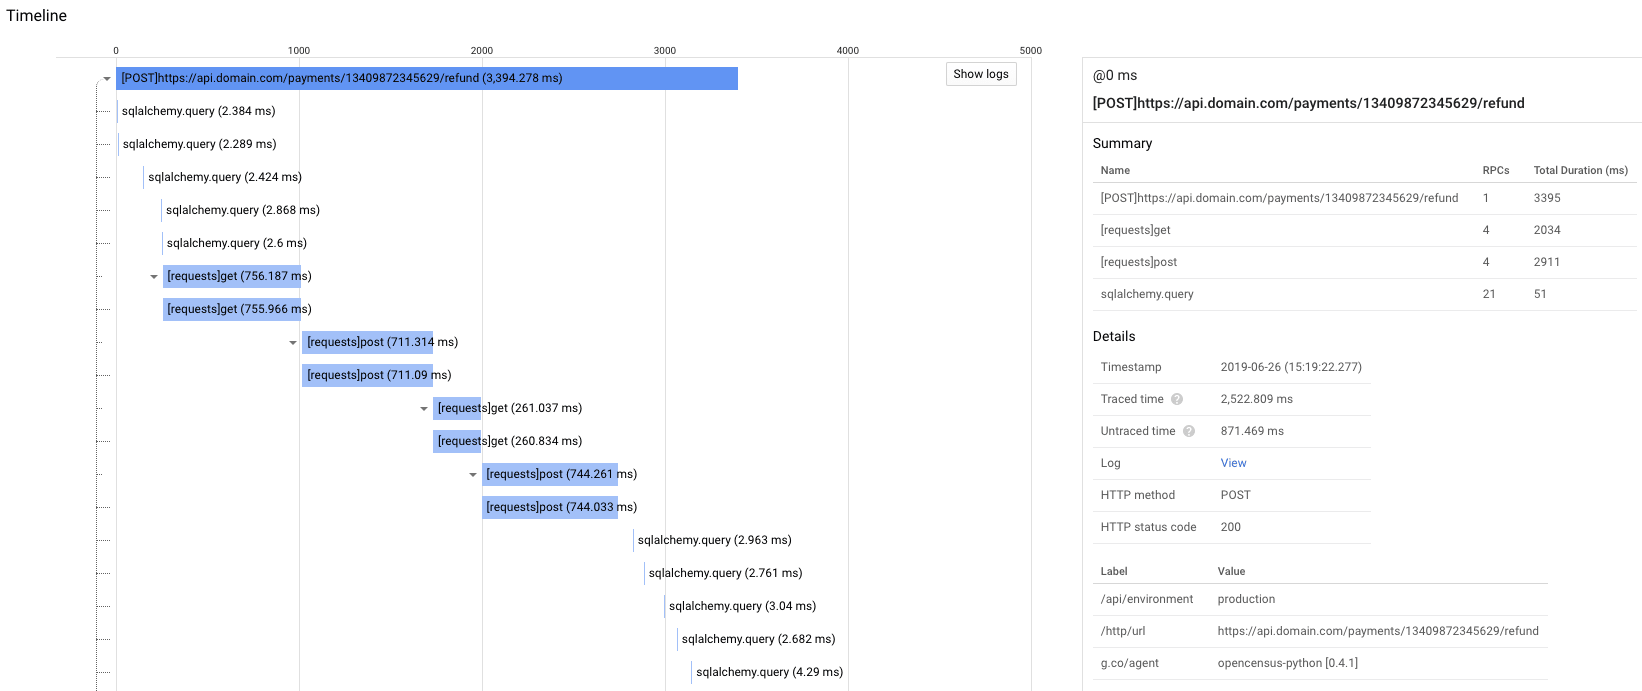
Searching for specific traces in Stackdriver Trace is quite a pain: you cannot look for patterns within a request URL; only prefixes or exact matches...
Because of that I couldn't find the specific traces of the few requests that took more than 5s to complete, but this one lasted more than 3s and already gives us a good idea of what's going on.
It's actually quite obvious from the spans: the requests tracer is showing me four very long HTTP requests. Three of them took more than 700ms to complete, the last one took almost 300ms.
Those requests are Stripe calls. Here are the details for one of them:
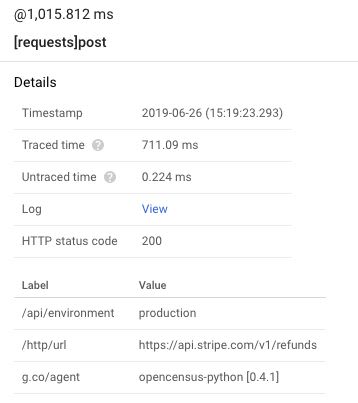
These details give me information on the span: what URL was called by requests, the HTTP status code, the time it took to complete, and so on.
Adding custom labels such as the /api/environment on it will be subject for another article.
So calling Stripe to perform a refund on a charge takes 700ms. Right.
There's nothing I can do about it, but at least I know what's going on.
Because my code sometimes needs to call Stripe's API multiple times per refund operation, it becomes clear that those refund requests will regularly be quite long.
Being able to discover and understand such bottlenecks in a few clicks with Trace is what makes it powerful.
Analytics reports
On top of providing detailed traces, Stackdriver Trace also generates analytics reports that can help you understand the latency of your endpoints.
It will automatically create reports for the most used endpoints, such as this one:
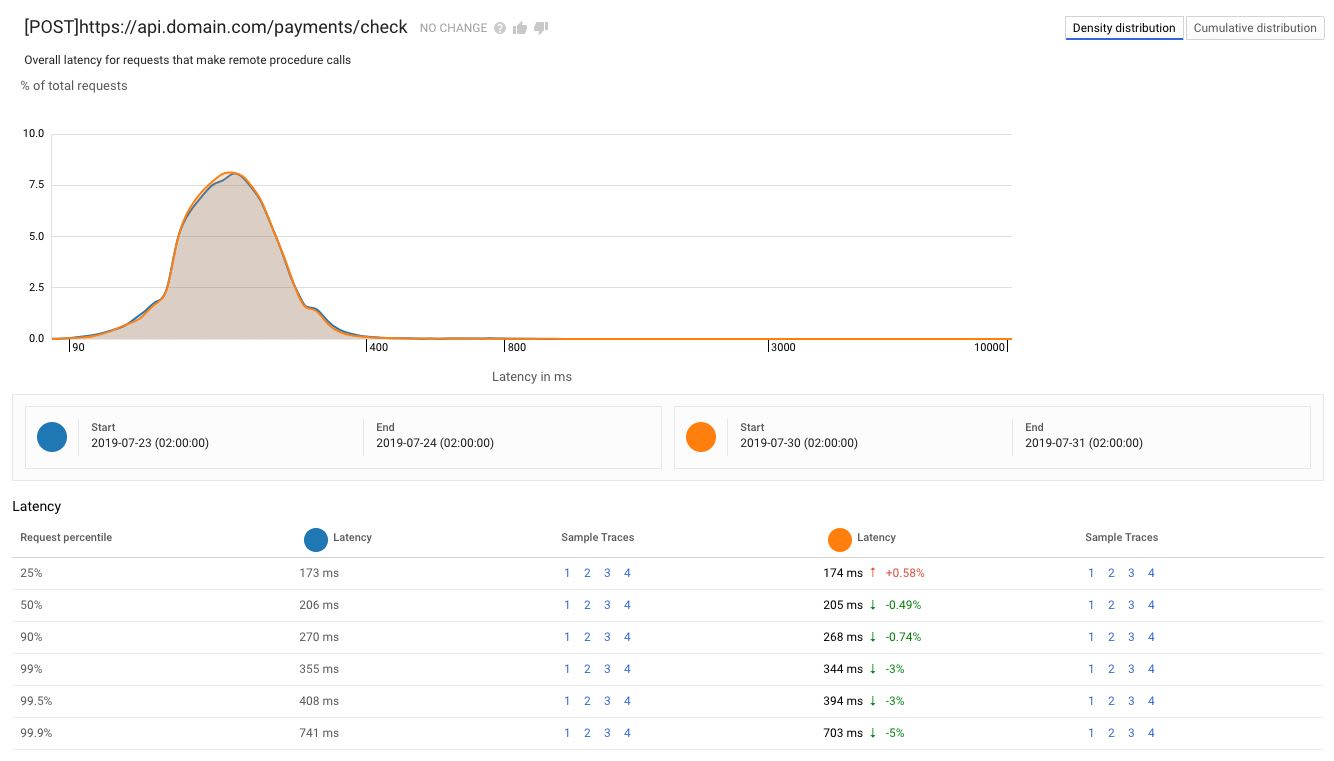
This view shows me the mean latency for the endpoint and the distribution around that value, whereas the cumulative distribution view helps understand the quantity of queries that are slower or faster than a given threshold:
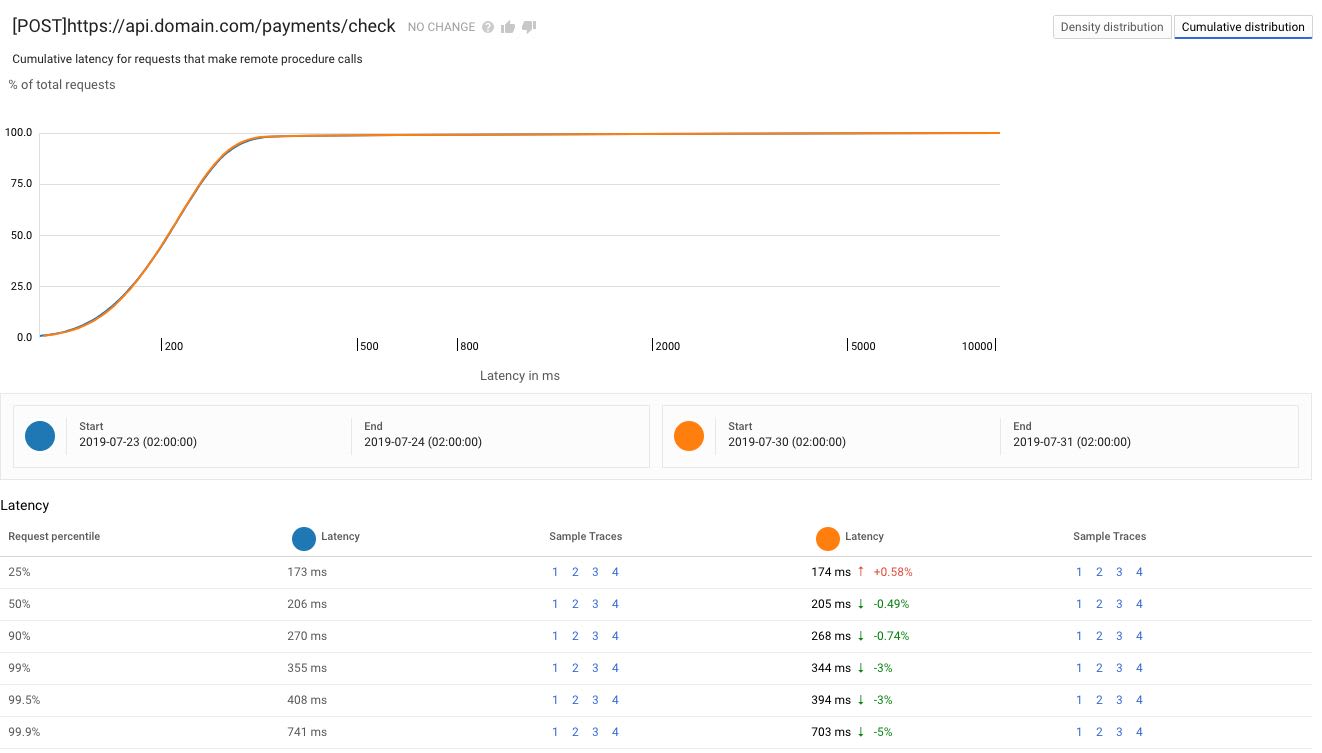
In both cases I also get percentiles that provide the same kind of information. In this case, 99% of the requests took 344ms or less to complete, which is a 3% improvement on the previous period.
I can also create my own reports with custom filters. One with just latency:200ms will be a good one to watch as we start working on improving our API performance:
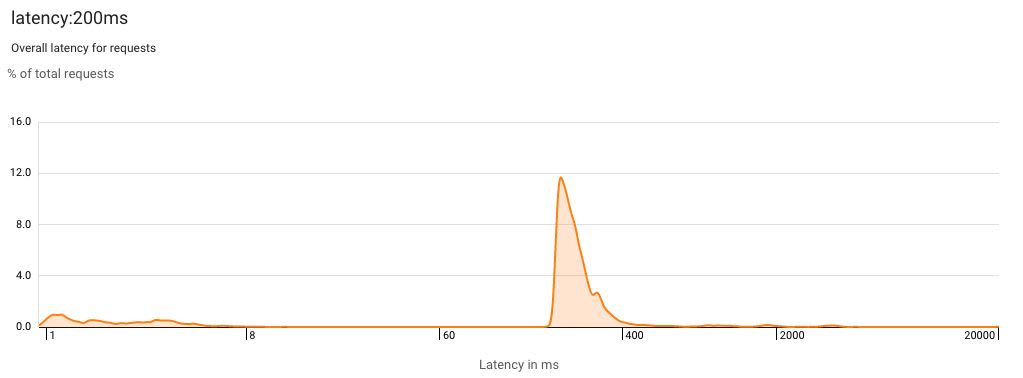
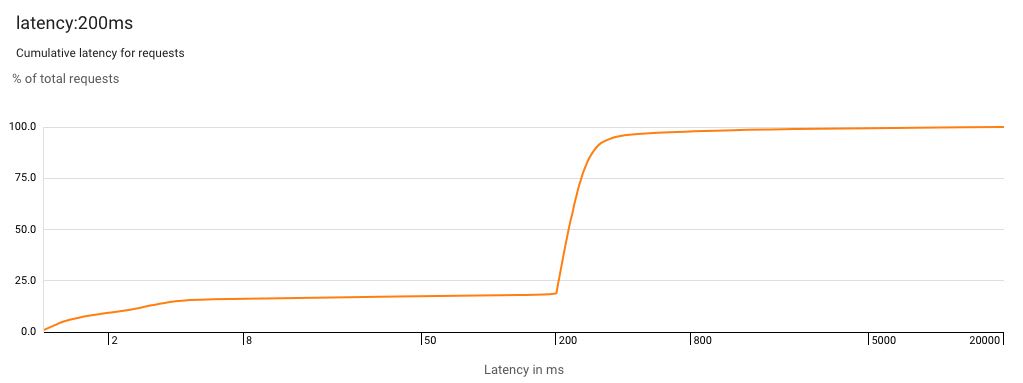
We definitely want to shift those spikes to the left!
What's interesting is that Stackdriver will even give us a few pointers to start exploring our main bottlenecks:
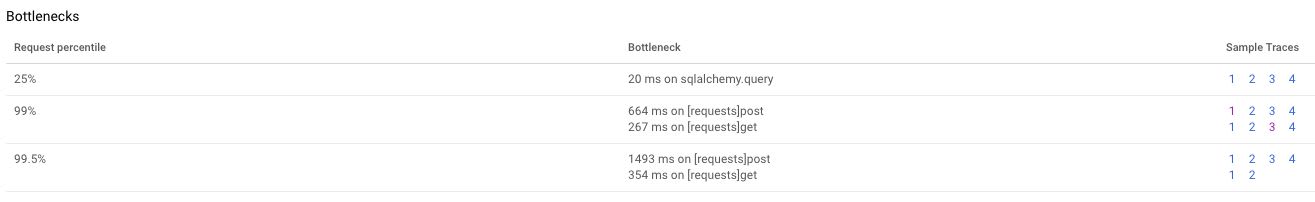
Clicking on the sample traces links opens, well, sample traces, which show the bottlenecks Stackdriver has identified.
Wrapping it up
Latency in web applications can be a pain. In my case, it caused serious production issues as I got repeated refunds happening when only one should have taken place.
Solving the idempotency issue I mentioned was of course the best way to overcome the problem, but it still meant replying to Shopify's webhooks with too high a delay.
Instrumenting our code with traces allowed to understand that Stripe calls were always going to take too long to keep us below the 5s mark, and I redesigned the way we handle refund webhooks with that new knowledge.
On top of that, searches such as latency:200ms (find all traces lasting more than 200ms) allowed us to identify other endpoints that take too long to process. which is always good to know and fix in an API!
