In my research for an integration of React with Rails, I have encountered a very annoying error on the server side when pre-rendering some React components. It was even more frustrating that I didn't know how to debug my script when it was executed on the server to find out what the problem was.
After some digging and thanks to the help of Matt Hink I finally found a way to get a debug session in javascript code executed on the server.
Running in debug mode
The solution was of course to execute this server-side script in debug mode, but how one is supposed to do that?
Once you understand how Javascript is executed within a Rails app it really looks easy, however I have found no documentation whatsoever about debugging and that didn't make it so easy at first. The reason for this is probably well summarized in this quote:
ExecJS isn't designed for or intended to be used as a debugging environment. - @josh, on a Github issue
In your Rails project, when some Javascript needs to be run on the server, there's a lib called ExecJS that is used to do this job. ExecJS is just a "front end" lib though, which interfaces with other libs to actually execute your JS code using the runtime you prefer. You probably know about therubyracer, which embeds a V8 engine to run Javascript from Ruby? I'd say it is the runtime that is the most frequently used with ExecJS.
But therubyracer is not the only option, as you can also use therubyrhino, Mac OS JavascriptCore or even Node.js directly.
ExecJS is meant to execute JS by providing a common ground for all those runtimes, and the authors/maintainers are not looking for implementing high-level features such as debugging support. So how do we get to hook into our script?
ExecJS provides a very simple way to interface with external runtimes (ie. executing a binary instead of linking with a library) like Node.js. All you have to do is to declare an ExecJS::ExternalRuntime object with a command name and ExecJS will be able to launch this runtime with the script file to execute. Here's how the default Node.js runtime is defined:
module ExecJS
  module Runtimes
    # ...

    Node = ExternalRuntime.new(
      name:        "Node.js (V8)",
      command:     ["nodejs", "node"],
      runner_path: ExecJS.root + "/support/node_runner.js",
      encoding:    'UTF-8'
    )

    #...

  end
end
Note the :runner_path option: ExecJS will use the script referenced here to run your own code within a wrapper that will make sure the output conforms to what ExecJS is expecting.
So here's our solution: create a new external runtime instance with the correct command-line arguments to start a debug session and have ExecJS use it.
The simplest way I have found to do this is by using Node.js: its --debug-brk option will start a debug session and stop at the very first instruction of a script, waiting for a debugger to connect. As a bonus, because ExecJS already offers support for Node.js, we don't have to create our own runner script!
Here's our new external runtime definition:
if ENV['EXECJS_DEBUG']
    ExecJS.runtime = ExecJS::ExternalRuntime.new(
        name: 'Node.js Debug (V8)',
        command:     ['node --debug-brk'],
        runner_path: ExecJS.root + '/support/node_runner.js',
        encoding:    'UTF-8'
    )
end
Put this code into an initializer file in your Rails project (eg. config/initializers/execjs_debug.rb) and you have it: ExecJS will execute your server-side scripts using Node.js in debug mode!
You will of course need to install Node.js first and to run your Rails server with the EXECJS_DEBUG environment variable:
EXECJS_DEBUG= rails s
When you do, any script that is run using ExecJS will make your request hang, waiting for a debugger to connect to the default port (5858). So this environment variable comes handy as you don't always want to run a Javascript debugger with your Rails app.
Javascript debugger, you say?
Yup, you're going to need one!
Fortunately, there is a great tool available in the Node.js ecosystem that will make you feel at home if you're used to the Chrome Developer Tools: node-inspector.
Just install it:
npm install -g node-inspector
Then run it from your project root:
node-inspector
It will output an URL to open in your browser, that will load the developer tools. Note that you will need to use a Webkit-based browser (Chrome, Safari, Opera) to make it work.
Once it's ready, load the page of your website from which the script you want to debug will be run: the request will hang, waiting for the debugger to connect.
Reload node-inspector's page, and voilà!
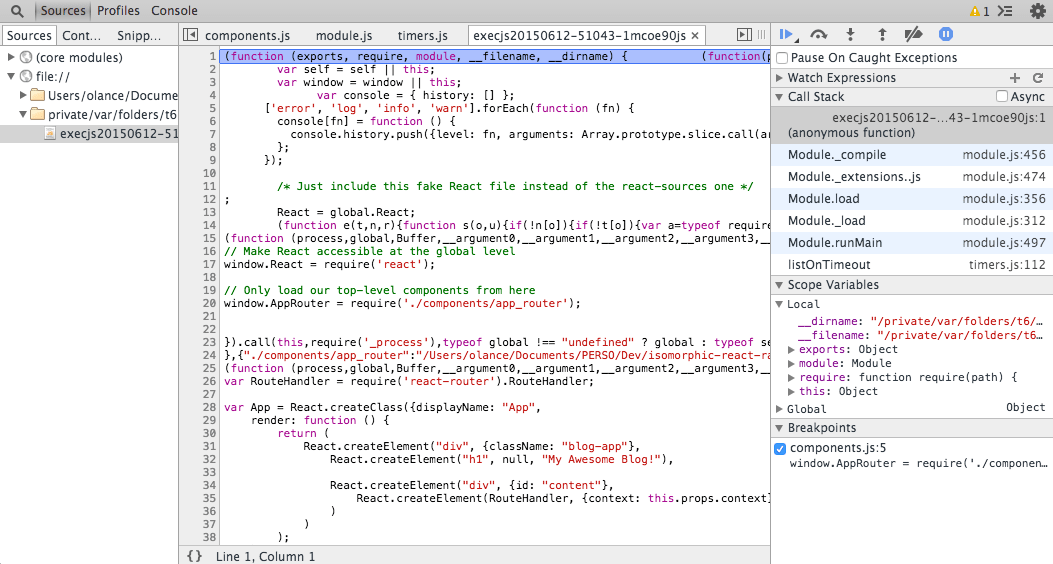
The execjs20150612–1mcoe90js file that you can see opened in the tool is the one ExecJS has started. In the case of using Rails, React and Browserify, this script contains all my JS code and its dependencies.
It may not be the simplest to work with but everything's here and you'll be able to set breakpoints, inspect variables, etc.
Two final notes on this:
- When the execution flows exits the script and ExecJS checks its result, it will crash trying to interpret it as a JSON string because Node.js outputs the string "debugger listening on port 5858". I haven't found a way to prevent this output, so it would need some tinkering to avoid this error.
This is a somewhat minor issue though, as it will happen only when you have finished stepping inside your script and leave the debugger. - The files listed in the left sidebar, at least in my case, won't be run except for the execjs one I mentioned. Do not set breakpoint in any other file, they won't be hit!
This could possibly be fixed using sourcemaps but I still have to figure out this point.
So this is it: you are now able to debug your server-side Javascript scripts!
